Row Zero is a powerful spreadsheet that makes it easy to work with large supply chain and logistics datasets. We’ve created a free spreadsheet version of the Freight Analysis Framework dataset.
The Freight Analysis Framework is a free, publicly available dataset published by the Bureau of Transportation Statistics and the Federal Highway Administration. It’s an invaluable tool for logistics and supply chain professionals that provides estimates of United States freight flows for different commodity types across all modes of transportation. Each row of the dataset captures a unique combination of origin region, destination region, transportation mode, and commodity, paired with tonnage, dollar value, and ton-miles.
This guide explains what the Freight Analysis Framework is, how to use it, a few common use cases, and a short example. At 2.7 million rows, the most recent version of the full dataset is much too large to work with using traditional spreadsheet tools. Row Zero is a powerful modern spreadsheet that allows you to seamlessly work with large datasets like the Freight Analysis Framework.
Freight Analysis Framework Dataset Summary
The Freight Analysis Framework provides a comprehensive picture of how freight moves across the United States, by origin, destination, transportation mode, and commodity type.
The current version, FAF5, is anchored to a 2017 base year and covers annual estimates through 2024, plus long-range forecasts at five-year intervals out to 2050. A separate, state-level database can be downloaded that goes back to 1997, providing nearly 3 decades of freight trends. The next version, FAF6, will be published soon in mid-2026.
Each record in the dataset captures a unique combination of region, destination region, mode of transport, and commodity, with measurements for tonnage (how much was shipped), value (in 2017 dollars), and ton-miles (weight multiplied by distance, a common measure of total transport activity).
The dataset covers all major modes of transportation - truck, rail, water, air, pipeline, and multi-modal. It classifies 42 different commodities according to the Standard Classification of Transported Goods (SCTG). For origin and destination locations, the dataset contains both state-level and metro-level geographic granularity. Additionally, import, export, domestic, and foreign through-traffic flows are all distinguished, allowing for both domestic and international supply chain and logistics analysis.
How to Use the Freight Analysis Framework
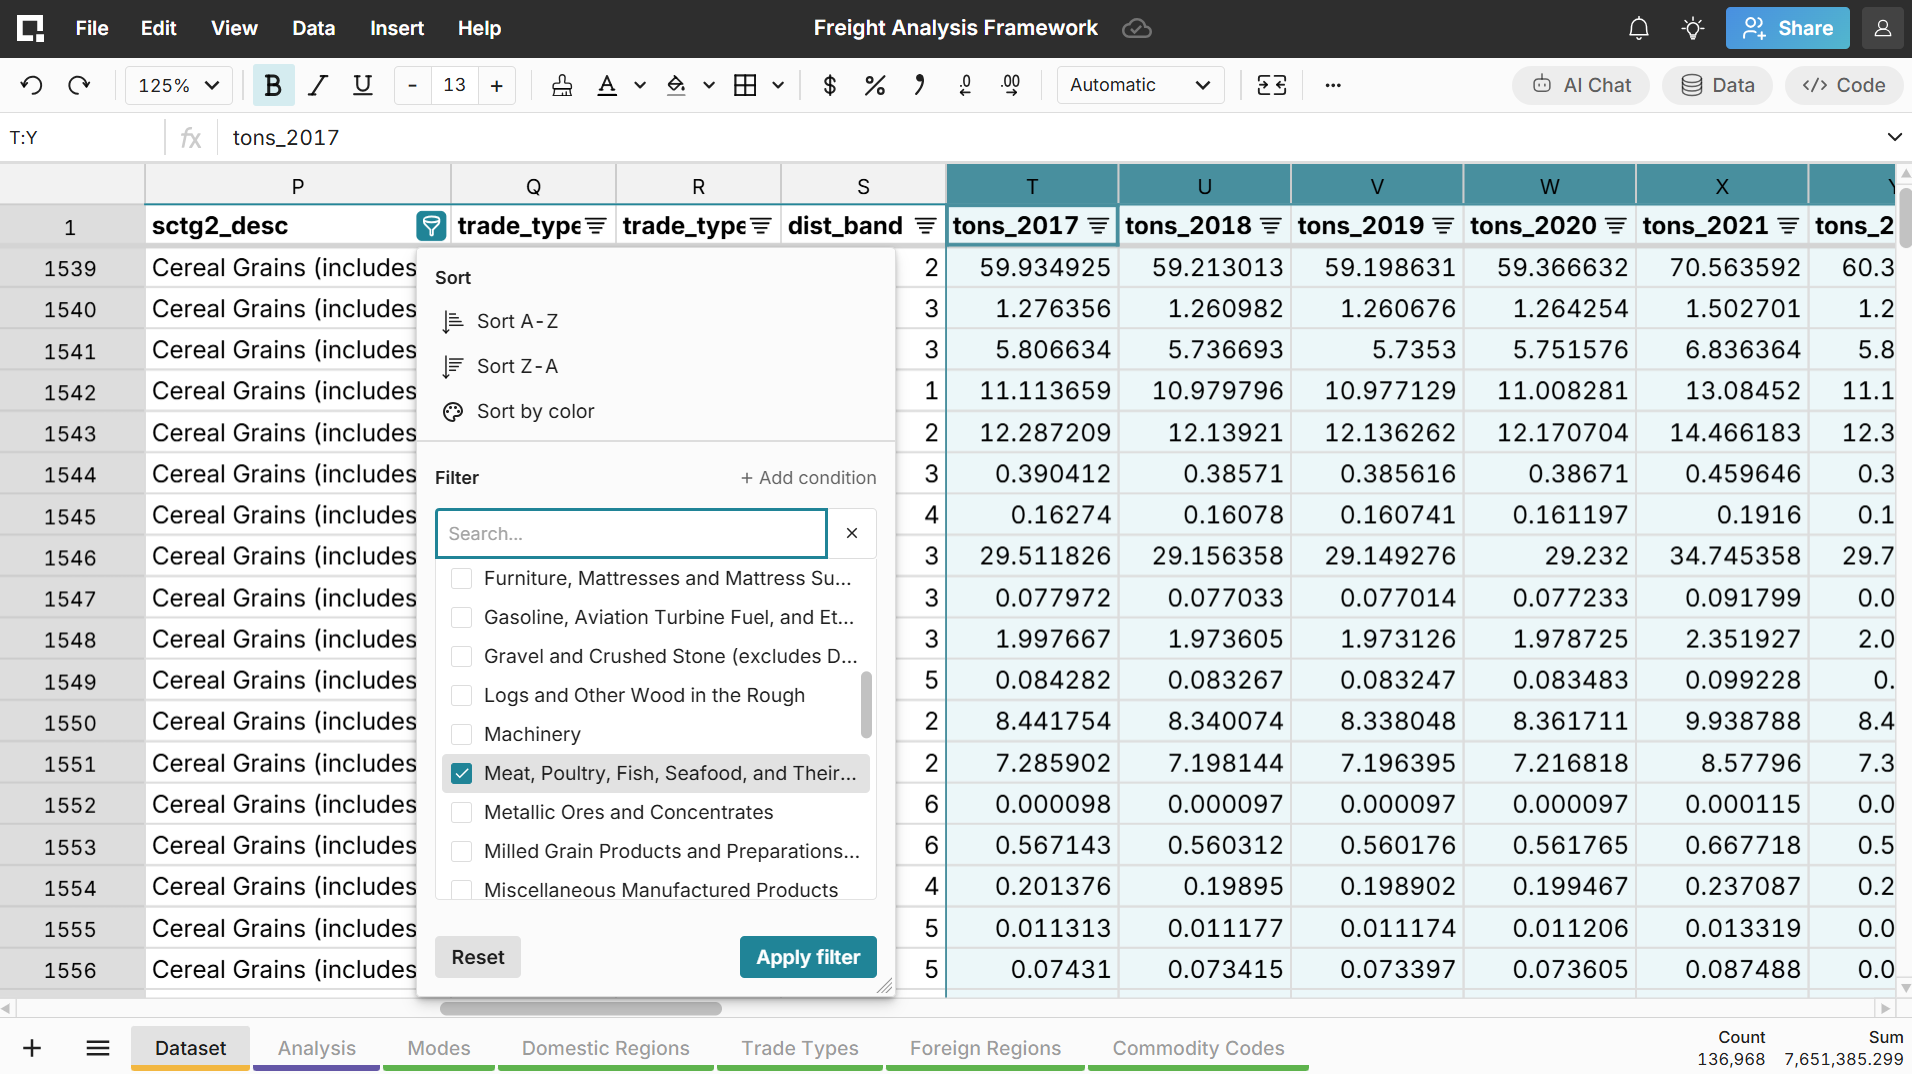
The Freight Analysis Framework is publicly available as a .csv download or Microsoft Access file from the Bureau of Transportation Statistics website. The FAF5 version of the .csv file is ~2.67 million rows, much too large for Excel or Google Sheets. However, the file quickly loads into a Row Zero workbook. We’ve made the dataset available in a Row Zero spreadsheet, along with some sample analyses.
If you are new to working with the dataset, the Freight Analysis Framework User’s Guide is a useful resource for understanding and interpreting the data. We’ll cover some of the basics here to get you started.
FAF5 organizes freight data around four dimensions: origin, destination, mode of transportation, and commodity type.
Origin and Destination Geographies
Geography is split into domestic and foreign contexts. For international flows, eight foreign regions are used (Canada, Mexico, Rest of Americas, Europe, Africa, SW & Central Asia, Eastern Asia, and SE Asia & Oceania). Domestically, FAF uses 132 regions, a mix of major metropolitan statistical areas and state-level remainders. These are identified by 3-digit codes. For instance, Washington state has 3 codes: 2 representing metro areas (531 - Seattle-Tacoma and 532 - Portland-Vancouver-Salem (WA Part)) and 1 representing the remainder of the state.
We’ve included the region codes and descriptions on the Domestic Regions and Foreign Regions tab of the Row Zero spreadsheet. We’ve also pulled these and all reference values directly into the dataset via XLOOKUP (added reference columns in the Dataset tab are those ending in “_desc”).
Modes of Transportation
Seven transportation modes are defined: Truck, Rail, Water, Air, Multiple Modes & Mail, Pipeline, and Other/Unknown. These codes are included on the Modes tab and pulled into the dataset.
Commodities
Commodities are classified using 42 two-digit SCTG codes, ranging from live animals (01) to mixed freight (43). These codes are all included in the Row Zero spreadsheet on the Commodity Codes tab and also available directly in the dataset.
For each combination of origin, destination, mode, and commodity type, there are columns for 2017-2024 tons, value, and ton-miles as well as forecasts for tons, value, and ton-miles for 2030, 2035, 2040, 2045, and 2050 for long-range planning.
Use Cases for the Freight Analysis Framework
There are a lot of common use cases for the Freight Analysis Framework for supply chain planners, logistics service providers, state departments of transportation, and other logistic and supply chain professionals. Row Zero makes it easy to analyze big logistics datasets in a spreadsheet. Here are a few examples of how you can make use of the Freight Analysis Framework data.
Plan where to expand your supply chain nodes
Companies evaluating where to locate warehouses, distribution centers, or manufacturing facilities can use Freight Analysis Framework to better understand the underlying freight geography of their industry. For instance, a food distributor deciding between 2 cities for a new distribution center can see the estimated freight flows for their commodity type into and out of each region, as well as how those values have trended over the last several years and how forecasted estimates expect them to trend in the future.
Determine market size and calculate market share
Logistics service providers, like carriers, brokers, and third-party logistics companies, can use Freight Analysis Framework to size freight markets in specific regions or lanes. For example, a trucking company thinking of expanding into a new market can understand the total addressable freight volume by commodity and mode to build a business case. Large carriers or brokers and/or carriers focused on specific commodity markets can also use FAF estimates as the denominator when calculating their own market share of freight for a given lane-commodity-mode combination.
Forecast long-range demand and model capacity needs
One of the really valuable aspects of the Freight Analysis Framework is that it not only provides estimates of actual volume going back several years, but it also includes forecasts out through 2050 in 5-year increments. Infrastructure providers like port authorities, state departments of transportation, and railway operators can use this for long-horizon planning and modeling future capacity needs by geographic region. Additionally, they can use the actual historical estimates to build their own models as well.
Example Analysis: Supply Chain Disruption from COVID
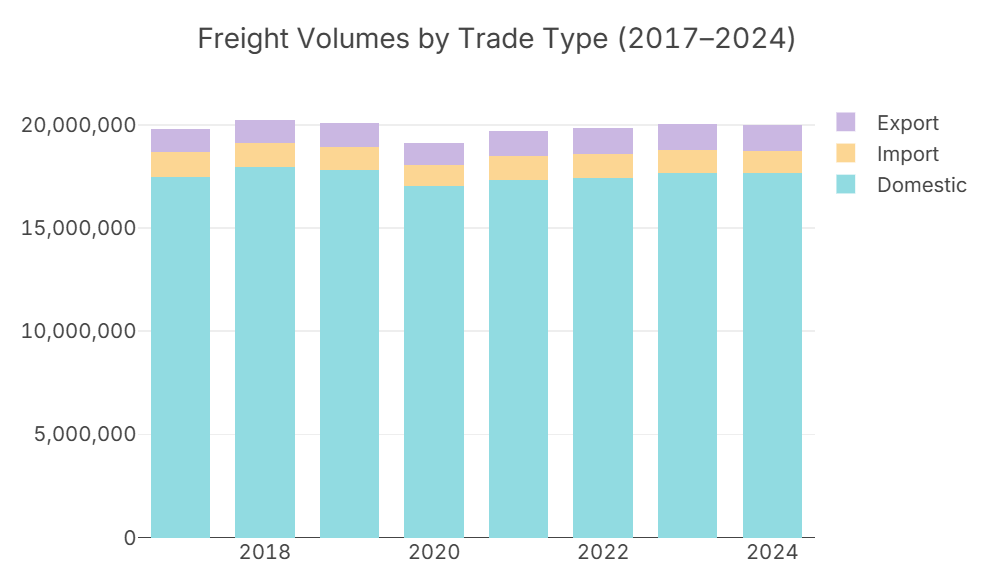
You can use the Freight Analysis Framework to see the impacts of Covid on the freight flows of various types of commodities and trade types (imports, exports, and domestic flows). Trade and freight flows were impacted by the economic slowdown tied to the COVID outbreak in 2020, but the impacts were different for different types of freight.
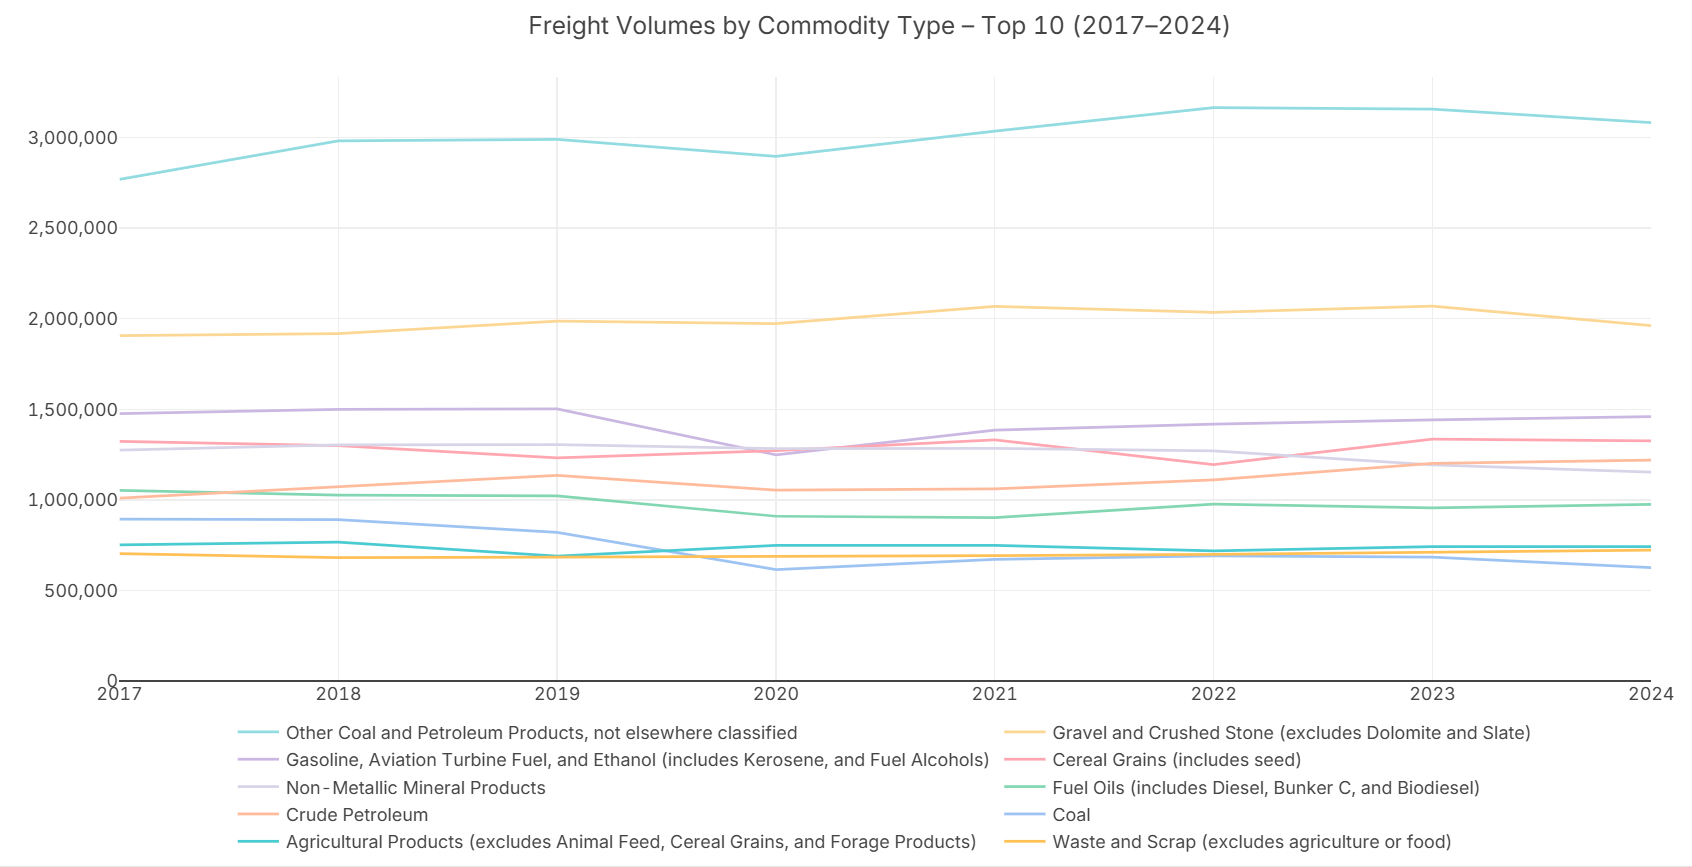
Looking at the top 10 commodity types by tonnage over time, you can see a dip in 2020 in many commodities, particularly travel-related columns like “Gasoline, Aviation Turbine Fuel, and Ethanol (includes Kerosene, and Fuel Alcohols)” and “Other Coal and Petroleum Products, not elsewhere classified.” Other food-related commodity types, like “Cereal Grains (includes seeds)” saw less of a COVID dip.
Interestingly, when you look at total tonnage volumes by trade type, there was a noticeable dip in Domestic freight in 2020, but Exports and Imports were less impacted.