Business Context
AWS cloud spend is one of the fastest-growing and most opaque line items in enterprise budgets. The AWS Cost and Usage Report (CUR) contains every answer a CFO needs: which accounts are driving growth, which services are being over-provisioned, and where Reserved Instance and Savings Plan coverage has gaps. But at 10 million rows it has historically been impossible to analyze in a spreadsheet. Row Zero changes that. This prompt generates the complete executive AWS cost dashboard covering total spend by account, service, and region; savings vs. on-demand equivalent; cost model coverage; environment waste; and year-over-year cost growth. All from the full 10-million-row dataset, at 100x the speed of Excel.
The Problem It Solves
- AWS Cost Explorer provides pre-built dashboards but cannot support ad-hoc CFO questions that require joining billing data with internal account metadata, team tags, and project context.
- The full Cost and Usage Report is too large for Excel or Google Sheets. Finance teams analyze samples or summaries and make $1M+ decisions on incomplete data.
- Reserved Instance and Savings Plan coverage gaps, where the company is paying full On-Demand rates it could avoid, are invisible without analyzing the full billing dataset.
- Non-Production environment spend (Dev, Staging, Sandbox) that runs 24/7 is a common source of 15 to 30% cost waste that never surfaces in aggregate reporting.
- Board and audit committee requests for cloud cost governance data require manual multi-day compilation from AWS billing exports, Cost Explorer, and finance systems.
AI Chat Prompt
Prompt to paste into Row Zero AI Chat
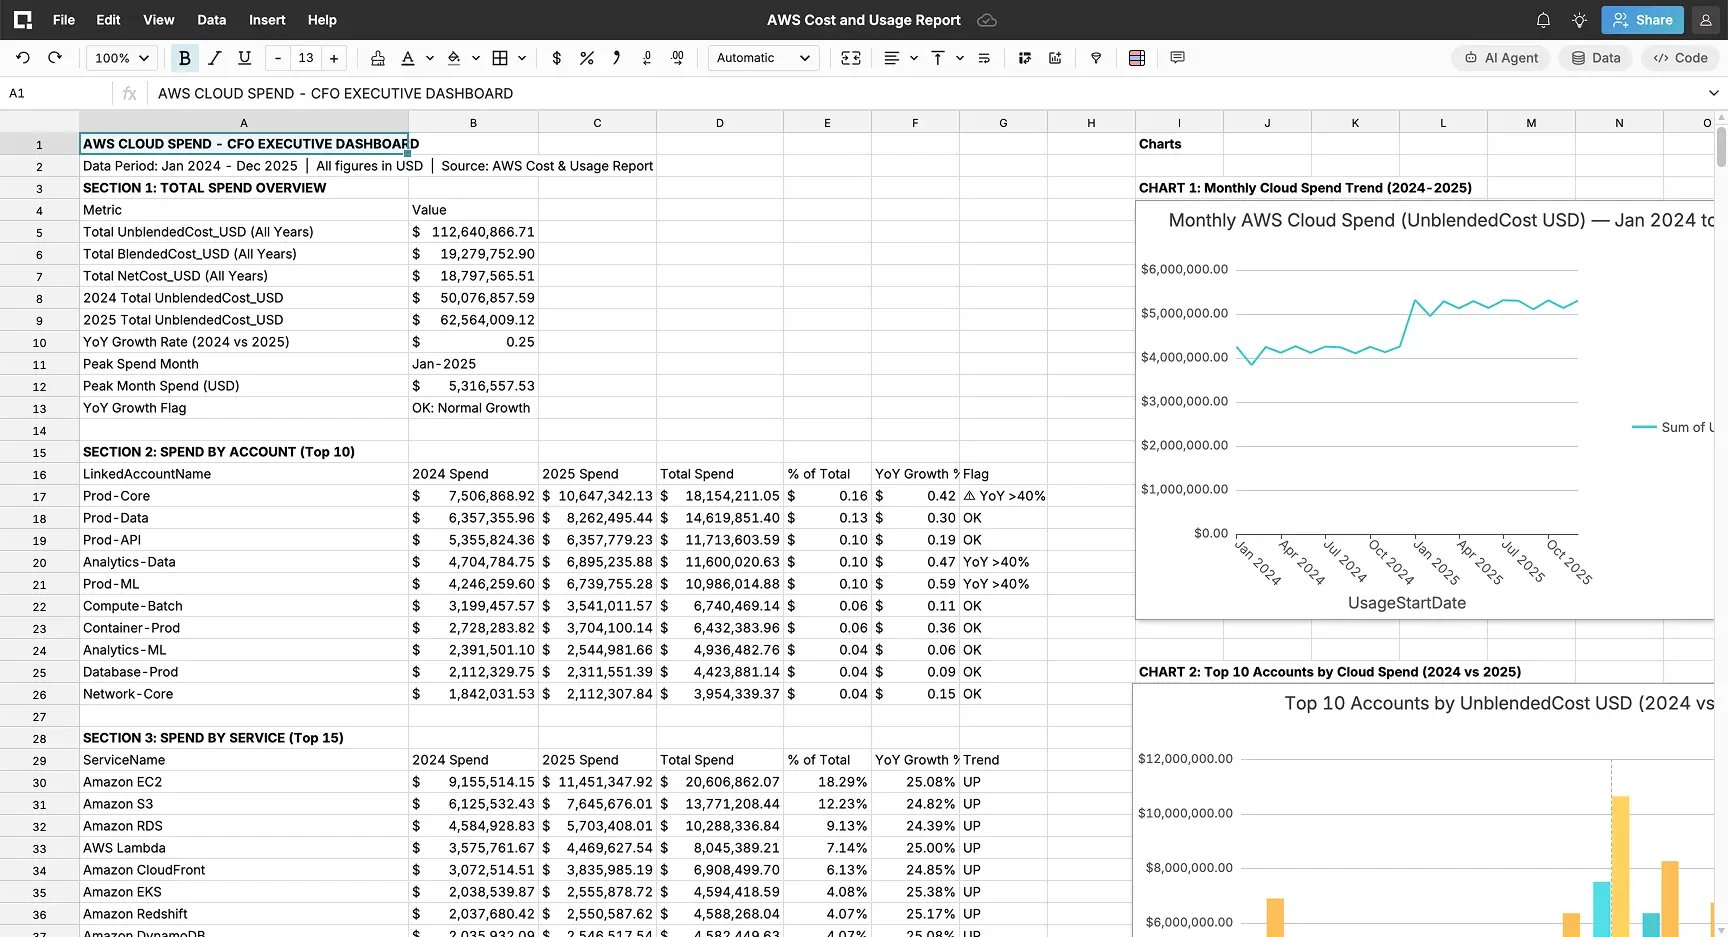
Analyze this AWS Cost & Usage dataset and generate a complete CFO Cloud Spend Executive Dashboard with the following sections:1. TOTAL SPEND OVERVIEW: Calculate total UnblendedCost_USD, BlendedCost_USD, and NetCost_USD for the full dataset. Show total spend by year (2024 vs 2025) and calculate YoY growth rate. Identify the single month with the highest total spend.2. SPEND BY ACCOUNT: Rank all LinkedAccountNames by total UnblendedCost_USD from highest to lowest. Show top 10 accounts, their % of total spend, and YoY growth rate. Flag any account where YoY spend growth exceeds 40%.3. SPEND BY SERVICE: Rank all ServiceNames by total UnblendedCost_USD. Show top 15 services, their % of total spend, and cost trend direction (2024 vs 2025). Identify the top 3 fastest-growing services by spend.4. SPEND BY REGION: Total spend by Region — rank from highest to lowest. Flag any region where spend exceeds 30% of total company cloud spend.5. COST MODEL EFFICIENCY: Break down total spend by CostModel (On-Demand, Reserved-1yr, Reserved-3yr, Spot, Savings-Plan, Free-Tier). Calculate: (a) what % of spend is On-Demand (un-optimized), (b) total SavingsAmount_USD achieved vs. OnDemandCostEquivalent_USD, (c) effective savings rate % overall and by top 5 services. Flag any service in the top 10 by spend where On-Demand % exceeds 60%.6. ENVIRONMENT WASTE ANALYSIS: Calculate total spend by Environment (Production, Staging, Development, QA, Sandbox, DR). Calculate non-Production spend as % of total. Flag if non-Production spend exceeds 25% of total — this is the primary waste reduction opportunity.7. TEAM & PROJECT SPEND: Show total spend by Team and by Project — rank each from highest to lowest. Identify the top 3 teams and top 3 projects by total cloud spend.8. RISK FLAGS: Automatically flag: any LinkedAccount with YoY growth > 40%, any Service where On-Demand % > 60% of spend, non-Production environments > 25% of total spend, and any Region with > 30% spend concentration.Conclude with a 6-sentence CFO executive summary covering total cloud spend, YoY growth, savings achieved vs. opportunity, the single largest cost reduction opportunity identified, and a recommended 90-day FinOps action plan. Ensure that all charts that are created are based on standard table pivots. Ensure all charts are labeled properly.Each pivot table should start in column (A) and include 3 empty rows for spacing between each pivot table. Each chart associated with a pivot table should start in Column (I). None of the charts or pivot tables should overlap. Add the CFO Executive Summary to complete the dashboard. Place it below the last pivot table in column (A) with 3 rows of empty spacing in between.How to Use This Prompt
- Create your free account
- Go to the AWS Cost & Usage Report dataset
- Launch the AI Chat panel in Row Zero (top-right corner of the spreadsheet interface)
- Paste the prompt exactly as written into the AI Chat input and press Enter
- The AI chat feature will build a new workbook called CFO Dashboard
- Run follow-on prompts to address any formatting issues
- Drill into any flagged account, service, or environment for root cause analysis
- Use the CFO executive summary to build a narrative
Key Metrics This Unlocks
| Total Cloud Spend | On-Demand % of Spend | Savings Achieved | Non-Prod Spend % |
|---|---|---|---|
| YoY growth rate | Optimization gap | vs. On-Demand equiv. | Waste flag: > 25% |
Expected Insights for Executives
- Total cloud spend trajectory: whether AWS costs are growing proportionally to the business or outpacing revenue. This is the board's primary FinOps governance question.
- The On-Demand spend percentage reveals the immediate cost reduction opportunity: every dollar of On-Demand spend on a workload that could be Reserved or Savings-Planned is being overpaid by 20-45%.
- Account-level spend concentration: which linked accounts are driving cost growth and whether that growth aligns with their business value to the organization.
- The fastest-growing services by spend, whether EC2, SageMaker, or Redshift is the primary cost driver, determines which engineering teams need a FinOps engagement immediately.
- Non-Production environment waste: Development, Staging, and Sandbox environments that run 24/7 typically represent 15-30% of total cloud spend and can be reduced by 60-80% with auto-shutdown policies.
- The savings rate achieved (actual BlendedCost vs. OnDemandCostEquivalent) quantifies the ROI of the existing FinOps program and the gap that remains. This is the CFO's most important cloud efficiency KPI.
Suggested Follow-On Prompts
For the top 3 LinkedAccounts by spend — break down their cost by ServiceName and CostModel. How much of their spend is On-Demand vs. Reserved? What is the savings opportunity if we achieved 70% Reserved coverage?Show me the month-by-month spend trend for Amazon EC2 and Amazon SageMaker in 2024 — are costs accelerating, and which Teams are driving the increase?Calculate the annualized cost of our non-Production environments running 24/7 vs. what they would cost with an 8-hour weekday auto-shutdown schedule (assume 65% runtime reduction). What is the annual savings?