Explore an AWS cost and usage report spreadsheet with 10 million rows of billing data across 30 linked AWS accounts, 36 services, 15 regions, and 2 full years of hourly usage history. The dataset includes pre-built cost dimensions for environment, team, and project — making it immediately useful for FinOps analysis, cloud cost governance, and executive reporting. While the example uses sample data, yyou can connect your Cost & Usage report data from the AWS billing console via a data export or S3 to pull in live data and build an auto-updating cloud cost dashboard.
This example AWS Cost & Usage Report spreadsheet includes 5 sheets, covering the full FinOps analysis workflow — from raw billing line items to executive dashboard:
- Cost & Usage (Raw) — 10 million rows of AWS billing line items with 30 columns: InvoiceId, LineItemType, UsageStartDate, LinkedAccountId, LinkedAccountName, ServiceName, UsageType, Operation, AvailabilityZone, Region, ResourceId, UsageQuantity, UsageUnit, UnblendedCost_USD, BlendedCost_USD, NetCost_USD, AmortizedCost_USD, OnDemandCostEquivalent_USD, SavingsAmount_USD, SavingsPercentage, DiscountPercentage, CostModel, ReservationARN, SavingsPlanARN, Environment, Team, and Project. This sheet is the source of truth for all analysis in the workbook.
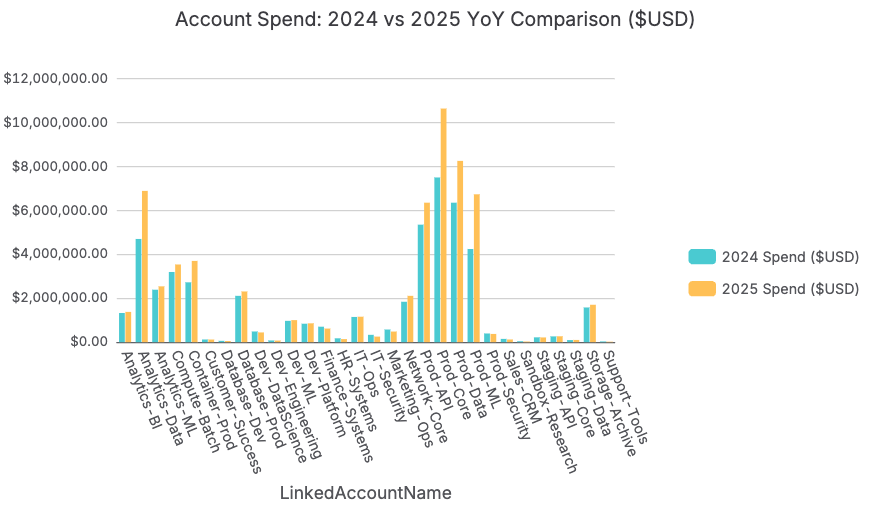
- Account Summary — Spend aggregated by LinkedAccountName and by year. Includes total UnblendedCost, YoY growth rate, and a flag for accounts where spend growth exceeds 40%. Uses SUMIFS formulas referencing the raw data sheet. Mirrors the account-level cost attribution that FinOps and finance teams need for internal chargeback and budget variance reporting.
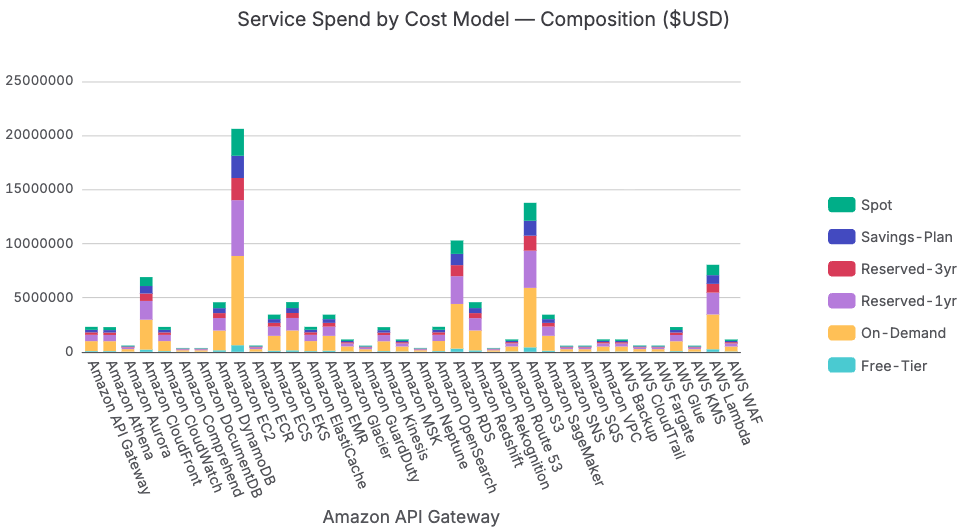
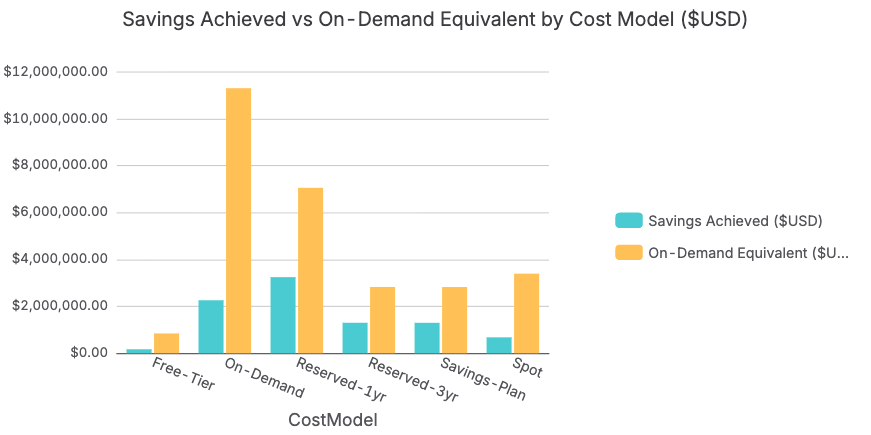
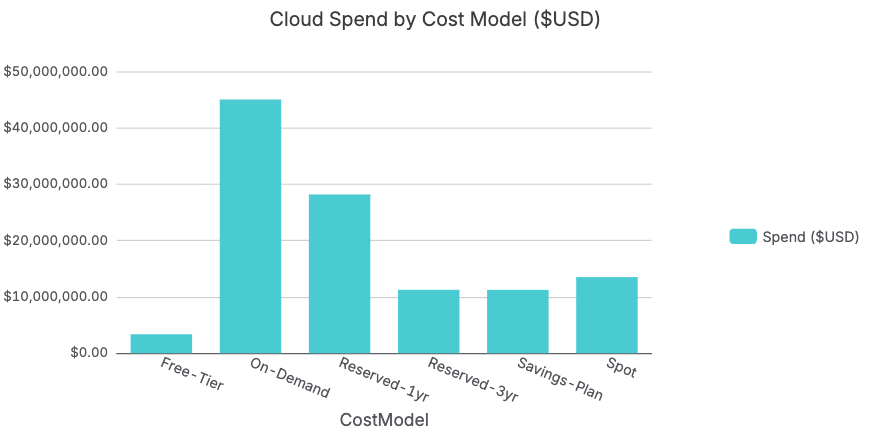
- Service & Cost Model Analysis — Spend by ServiceName broken down by CostModel (On-Demand, Reserved-1yr, Reserved-3yr, Spot, Savings-Plan, Free-Tier). Calculates the On-Demand percentage for each service and flags any service where On-Demand exceeds 60% of total spend — the primary Reserved Instance and Savings Plan optimization signal. Also includes the Savings Achieved vs. OnDemandCostEquivalent comparison to quantify the existing FinOps program's ROI.
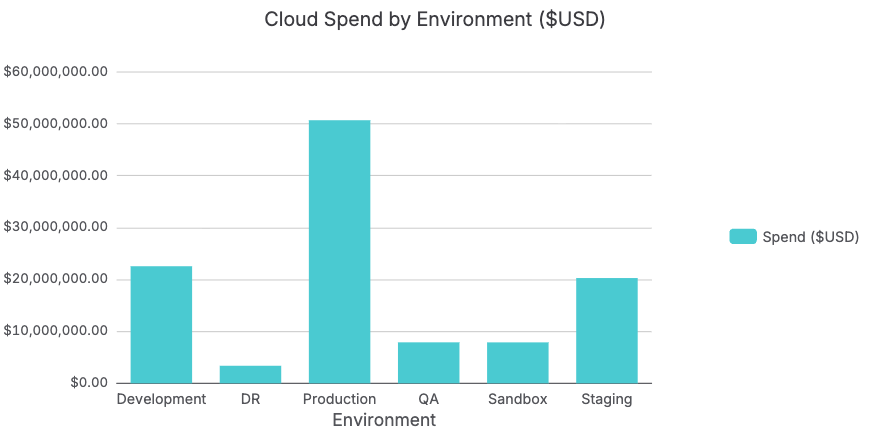
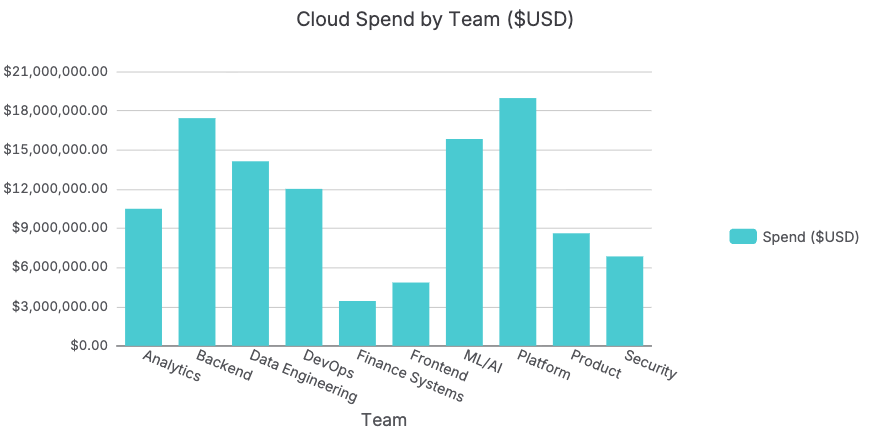
- Environment & Team Spend — Spend broken down by Environment (Production, Staging, Development, QA, Sandbox, DR) and by Team. Calculates non-Production spend as a percentage of total — flagging organizations where Development and Staging environments running 24/7 represent 15–30% of total cloud spend that could be reduced through auto-suspension policies. Team-level attribution enables internal chargeback and FinOps accountability conversations with engineering leadership.
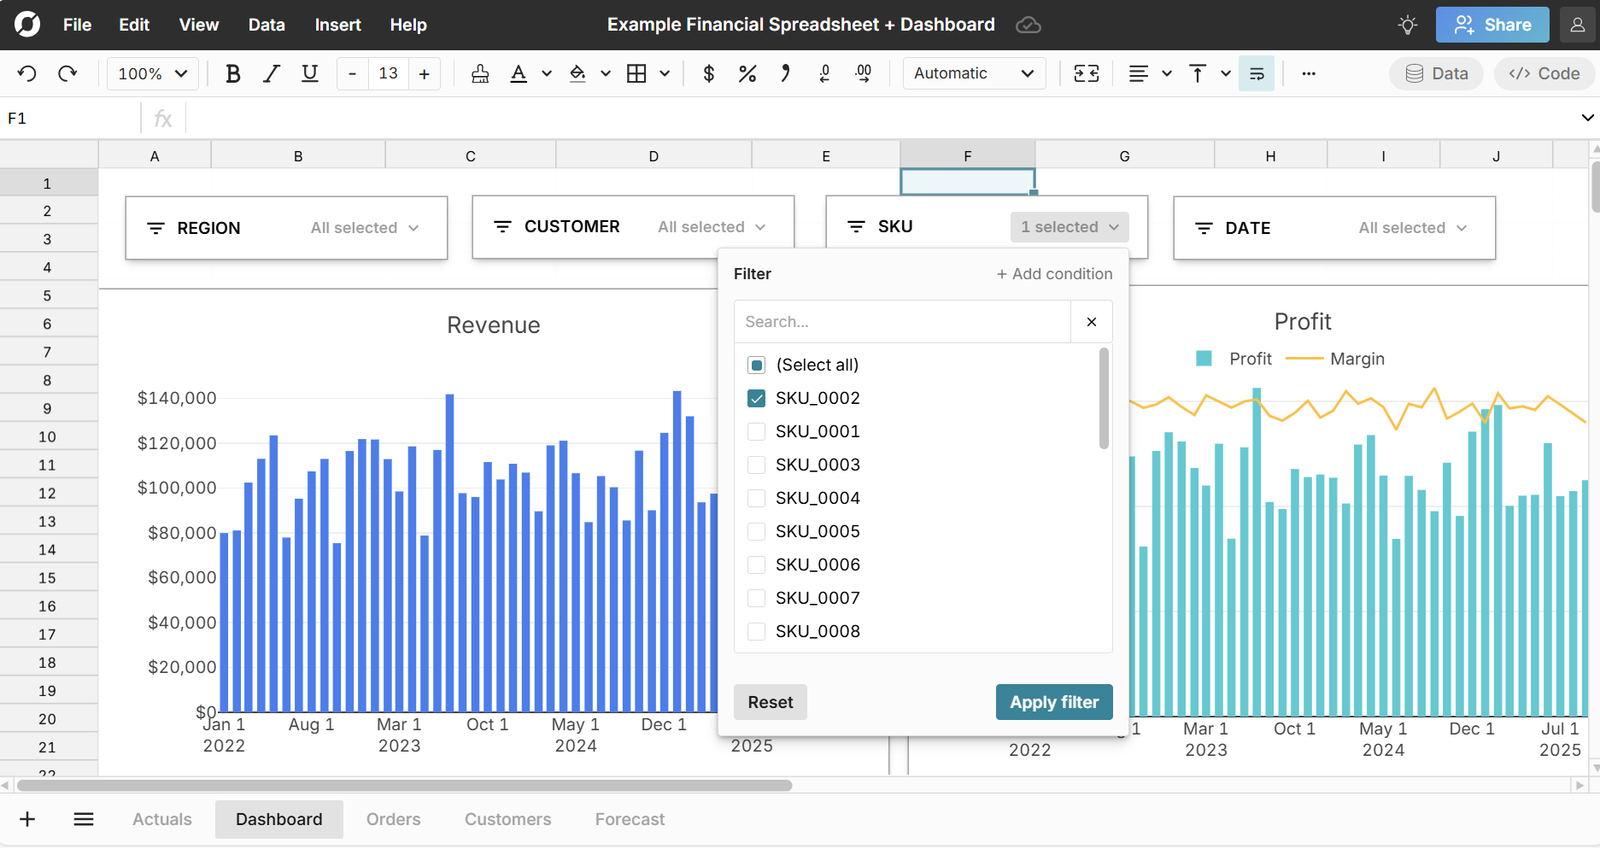
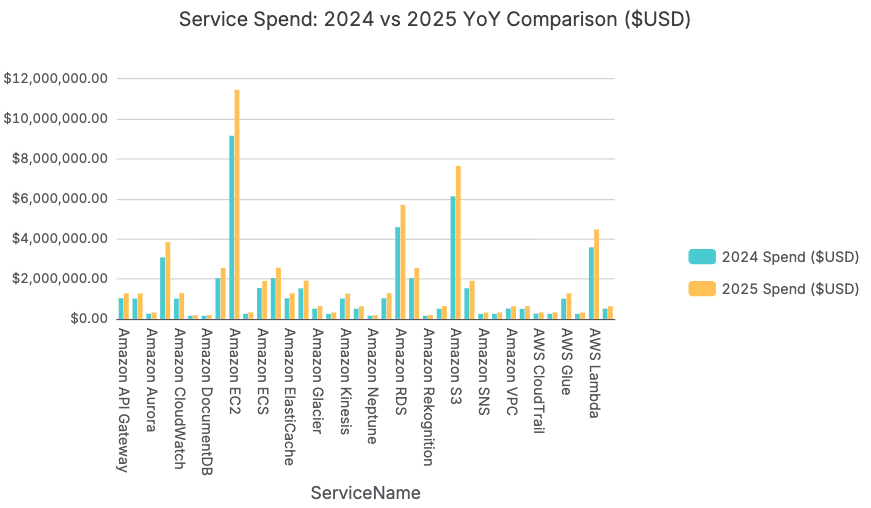
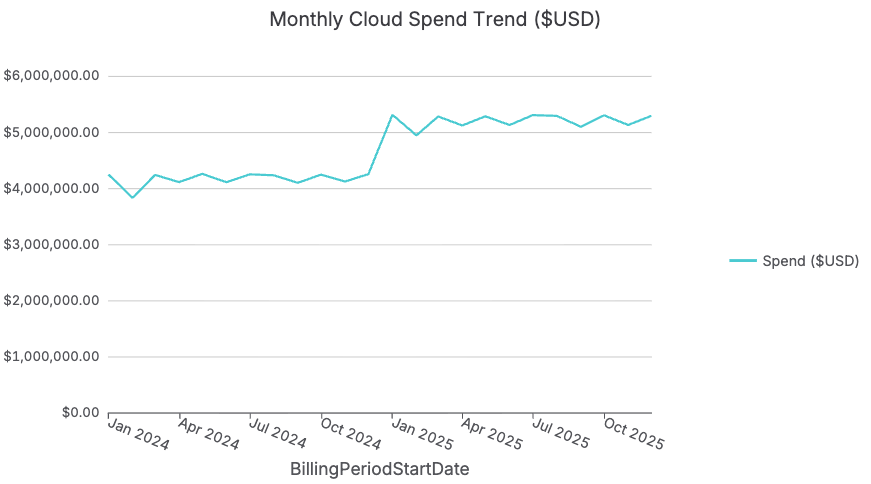
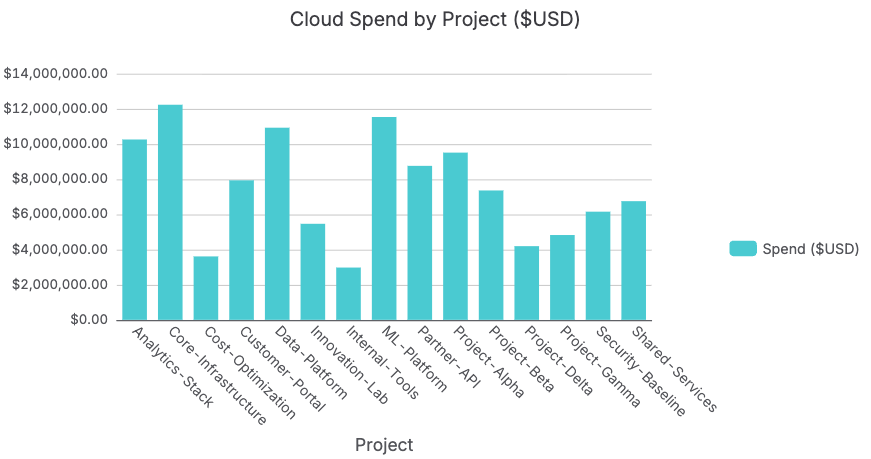
- FinOps Dashboard — Executive dashboard with 12 charts controlled by slicers for Region, Environment, Team, ServiceName, CostModel, and BillingPeriodStartDate. Charts include: Monthly Spend Trend, Spend by Linked Account, Account YoY Comparison, Spend by Service, Service YoY Comparison, Spend by Region, Spend by Cost Model, Service × Cost Model Composition, Savings vs. On-Demand Equivalent, Spend by Environment, Spend by Team, and Spend by Project. All charts update dynamically when slicers are adjusted. Note that the slicers dynamically filter each chart on the sheet.
Why Row Zero for AWS cost analysis
The AWS Cost & Usage Report is the most complete record of your organization's cloud spend — but at 10 million rows it has been practically inaccessible to finance and FinOps teams using Excel or Google Sheets.
Excel's 1,048,576 row limit means a standard enterprise CUR export is 10× too large to open at all. Google Sheets crashes before completing the import. Finance teams have been forced to work from sampled exports, pre-built Cost Explorer dashboards, or summary reports — making cloud cost decisions on 5–10% of the actual billing data.
Row Zero solves this with key capabilities that matter specifically for AWS cost analysis:
- Scale — Row Zero opens and analyzes all 10 million rows without sampling, truncation, or performance degradation. 1,000× more data than Excel can handle.
- Connectivity — Connect directly to Amazon Redshift, Amazon S3, Snowflake, or BigQuery where your live CUR data lands. Build auto-updating dashboards that refresh with every new billing period — no manual exports required.