Business Context
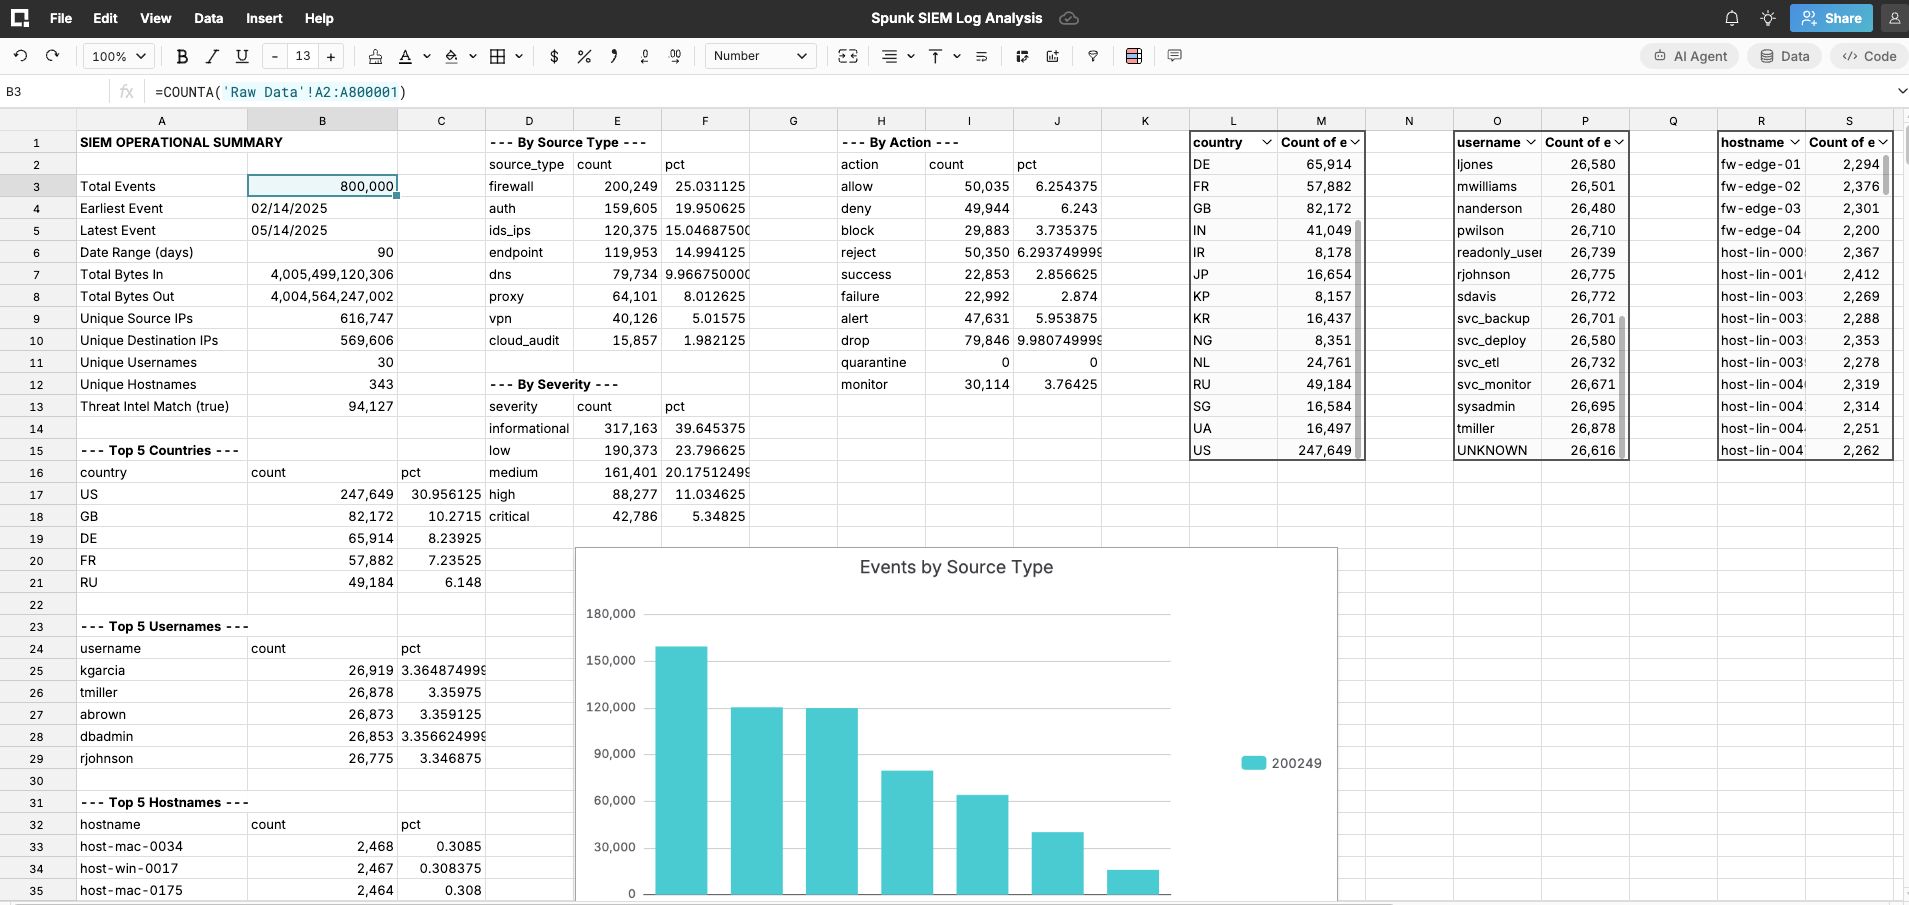
These prompts are designed to help security teams unlock actionable insights from Splunk SIEM and log Analysis dataset using the Row Zero AI Chat feature. Whether you're a SOC analyst investigating an active incident, a threat hunter chasing behavioral anomalies, or a CISO building an executive risk report — these prompts are engineered to produce immediate, high-value analysis from the 800,000-row sample dataset.
The Problem It Solves
- Analysts don't know what they're working with before they start investigating
When a SOC team loads 800,000 rows of Splunk data, they typically spend hours manually profiling it before any real analysis begins. Checking date ranges, counting source types, and identifying which log sources are even reporting can consume half a shift before a single alert gets touched. The Foundational Analysis Prompts solve this by generating a complete operational baseline in seconds: event volumes, severity distributions, unique host and user counts, threat intel match rates, and top-line anomalies, all in a single pass. - Logging gaps and blind spots go undetected until it's too late
A SIEM that appears healthy is often hiding silent failures. Agents that stopped reporting, source types with days of missing data, and log pipelines that quietly dropped events all create blind spots that look like normal operations. Prompt 3 (Log Source Coverage Check) surfaces exactly this: days where a source type produced zero events, consecutive gaps that suggest an outage or misconfiguration, and sensor coverage holes that attackers could exploit. Without this check, those gaps stay invisible until an incident proves they existed. - Analysts spend hours on setup that prevents them from doing actual security work
By running Prompts 1 and 2 at session open, any analyst regardless of experience level immediately has the context they need: what the data contains, where the highest-risk events are concentrated, and what the daily threat timeline looks like. It converts orientation time into investigation time.
Prompt 1 - Complete Dataset Summary
Use this as your first prompt every time you open the dataset. It establishes baseline volumes and surfaces the most important metrics at a glance.
Analyze this Splunk SIEM dataset and give me a complete operational summary. Include:

1. Total event count and date range covered
2. Breakdown of events by source_type (firewall, auth, ids_ips, endpoint, dns, proxy, vpn, cloud_audit)
3. Breakdown of events by severity (informational, low, medium, high, critical)
4. Count of unique source IPs, destination IPs, usernames, and hostnames
5. Count of events where threat_intel_match = true
6. Top 5 countries by event volume
7. Top 5 most active usernames
8. Top 5 most targeted hostnames
9. Count of events by action (allow, deny, block, success, failure, alert, etc.)
10. Total bytes_in and bytes_out across all events

Format the output as a clean executive summary table with counts and percentages. Add charts for all of the data tables.
Prompt 2 - Event Timeline (Daily Volume)
Understand event distribution over time. Spikes in daily volume often indicate attack campaigns, scanning activity, or misconfigured alerting.Prompt to paste into Row Zero AI Chat.
Create a daily event volume breakdown for this dataset. For each day in the dataset:

- Count total events
- Count events by severity (informational, low, medium, high, critical)
- Count events where threat_intel_match = true
- Flag any day where critical events exceed 50 or threat_intel_match events exceed 100

Sort by date ascending. Identify the top 3 highest-volume days and explain what might cause those spikes. Output as a table. Add charts for all of the data tables.
Prompt 3 - Source Type Health Check
Validate that all log sources are reporting consistently. Gaps or sudden drops in a source type can indicate logging failures, agent outages, or an attacker disabling sensors.
Create a daily event volume breakdown for this dataset. For each day in the dataset:

- Count total events
- Count events by severity (informational, low, medium, high, critical)
- Count events where threat_intel_match = true
- Flag any day where critical events exceed 50 or threat_intel_match events exceed 100

Sort by date ascending. Identify the top 3 highest-volume days and explain what might cause those spikes. Output as a table. Add charts for all of the data tables.
How to Use These Prompts
- Create your free account
- Go to the Spunk SIEM Log Analysis dataset
- Launch the AI Chat panel in Row Zero (top-right corner of the spreadsheet interface)
- Paste the prompt exactly as written into the AI Chat input and press Enter
- The AI chat feature will build a new workbook called SIEM Analysis, Daily Breakdown and Log Coverage.
- Run follow-on prompts to address any formatting issues