Row Zero was the world’s fastest spreadsheet when we launched in 2024. It’s even faster today.
But how do you measure that? There’s no standardized performance benchmark for spreadsheets. So we’ve had to make our own.
What we measure
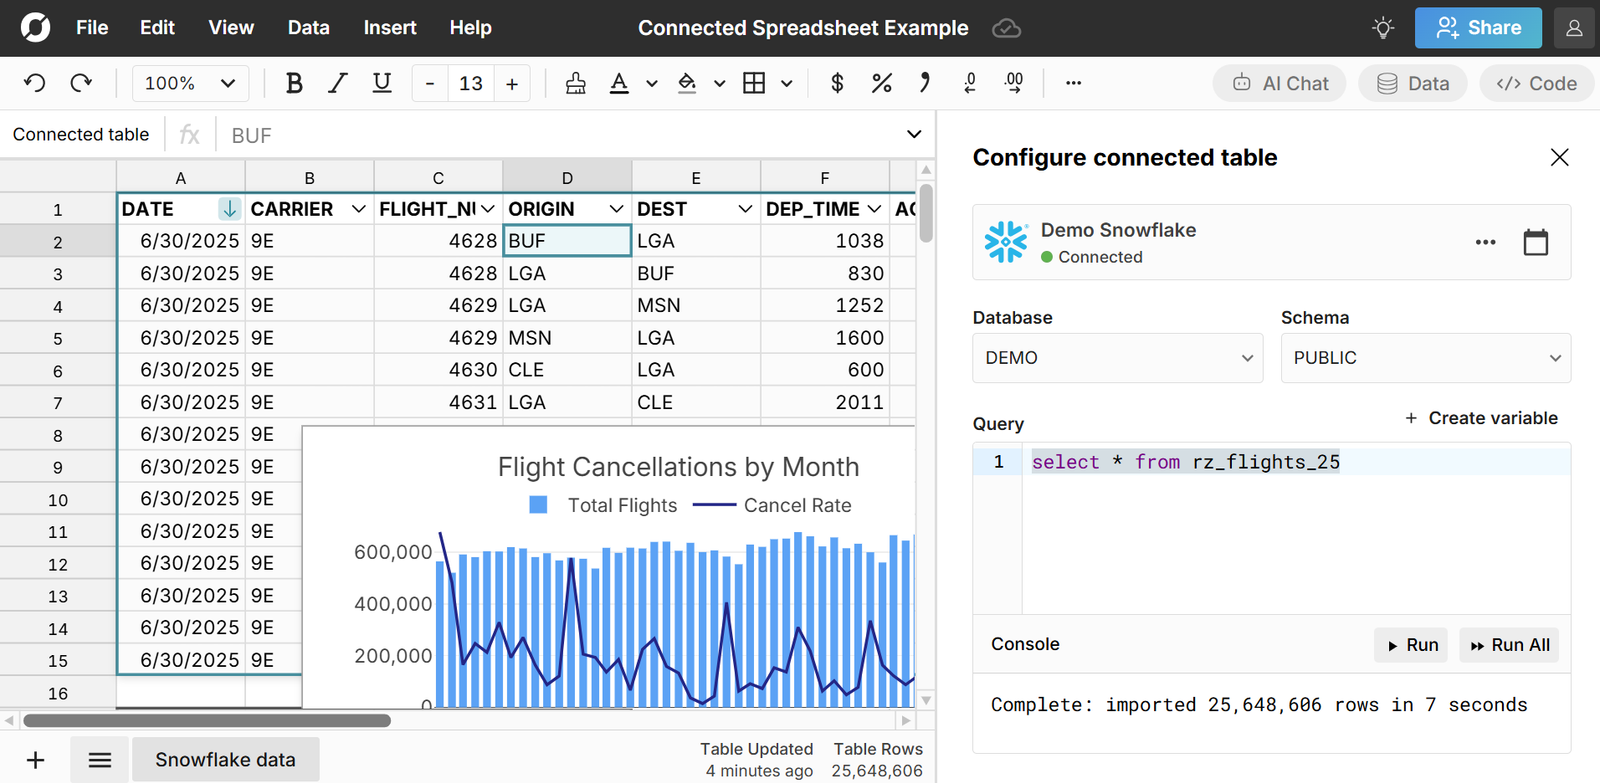
One such benchmark is our Pivot + COUNTIF + chart benchmark. We set up a workbook with 31 million rows of public data from New York state hospitals. In that workbook, we have a COUNTIF over the Admission Type column, a SUM over total charges, a pivot table that shows the number of admissions by type over time, and a chart of that pivot. Just these few elements exercise a surprisingly large portion of the performance-critical sections of the spreadsheet engine. You can check out a copy of the workbook for yourself: make a copy.
We automatically refresh the data in this workbook once a day from a static snapshot. In Row Zero, pivot tables, formulas, and charts all automatically recalculate when the data they reference changes, so this forces the whole workbook to recalculate at once. We measure how long that takes.
Over the last twelve months, we’ve gotten 4x faster on this benchmark.
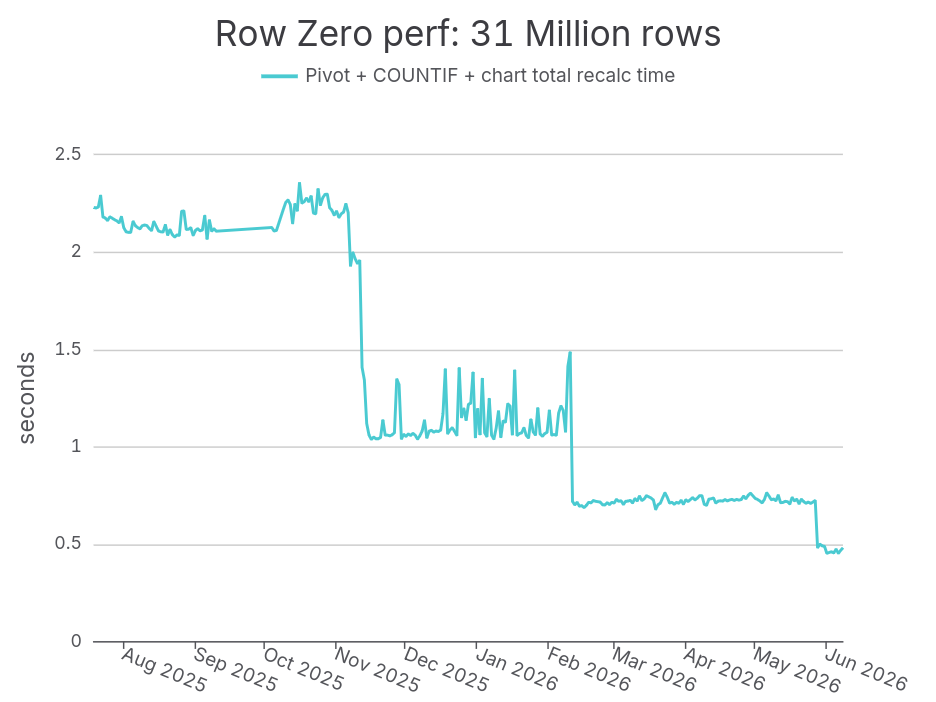
When we started measuring, it took us a little over 2 seconds to recalculate the pivot, COUNTIF, SUM, and chart. That was already best-in-class. (Excel and Google Sheets lose by default, since they can’t even load this much data to begin with.)
But we weren’t satisfied. And if you give our team of stellar systems engineers a clear target to optimize and the opportunity to work at it, they’ll make as fast as can be.
Just last month, my new colleague Tim MacPherson shipped a change that brought us under half a second for the first time! And we’ve recorded another 10% improvement since then.
How did we do it?
The wins have come from all over the spreadsheet engine. Better hashing algorithms. Improved parallelism and locality. DAG optimization. Static analysis. There’s no silver bullet, and every improvement compounds.
Tim’s recent change, for example, sped up computation of where in a column of data a COUNTIF predicate matches, essentially by using hash keys that are cheaper to compute when comparing two values for equality.
The key is that we have established consistent benchmarks, giving us a stable target to improve over time — and ensuring we don’t regress performance as we continue to add new features.
What’s next?
We aren’t done. There’s probably at least another 10% win to be found, by the next new engineer we add to the Row Zero team. And we’ll keep measuring and optimizing more and more complex cases as our customers push the boundaries of what’s possible in Row Zero. This is the frontier of spreadsheet performance.